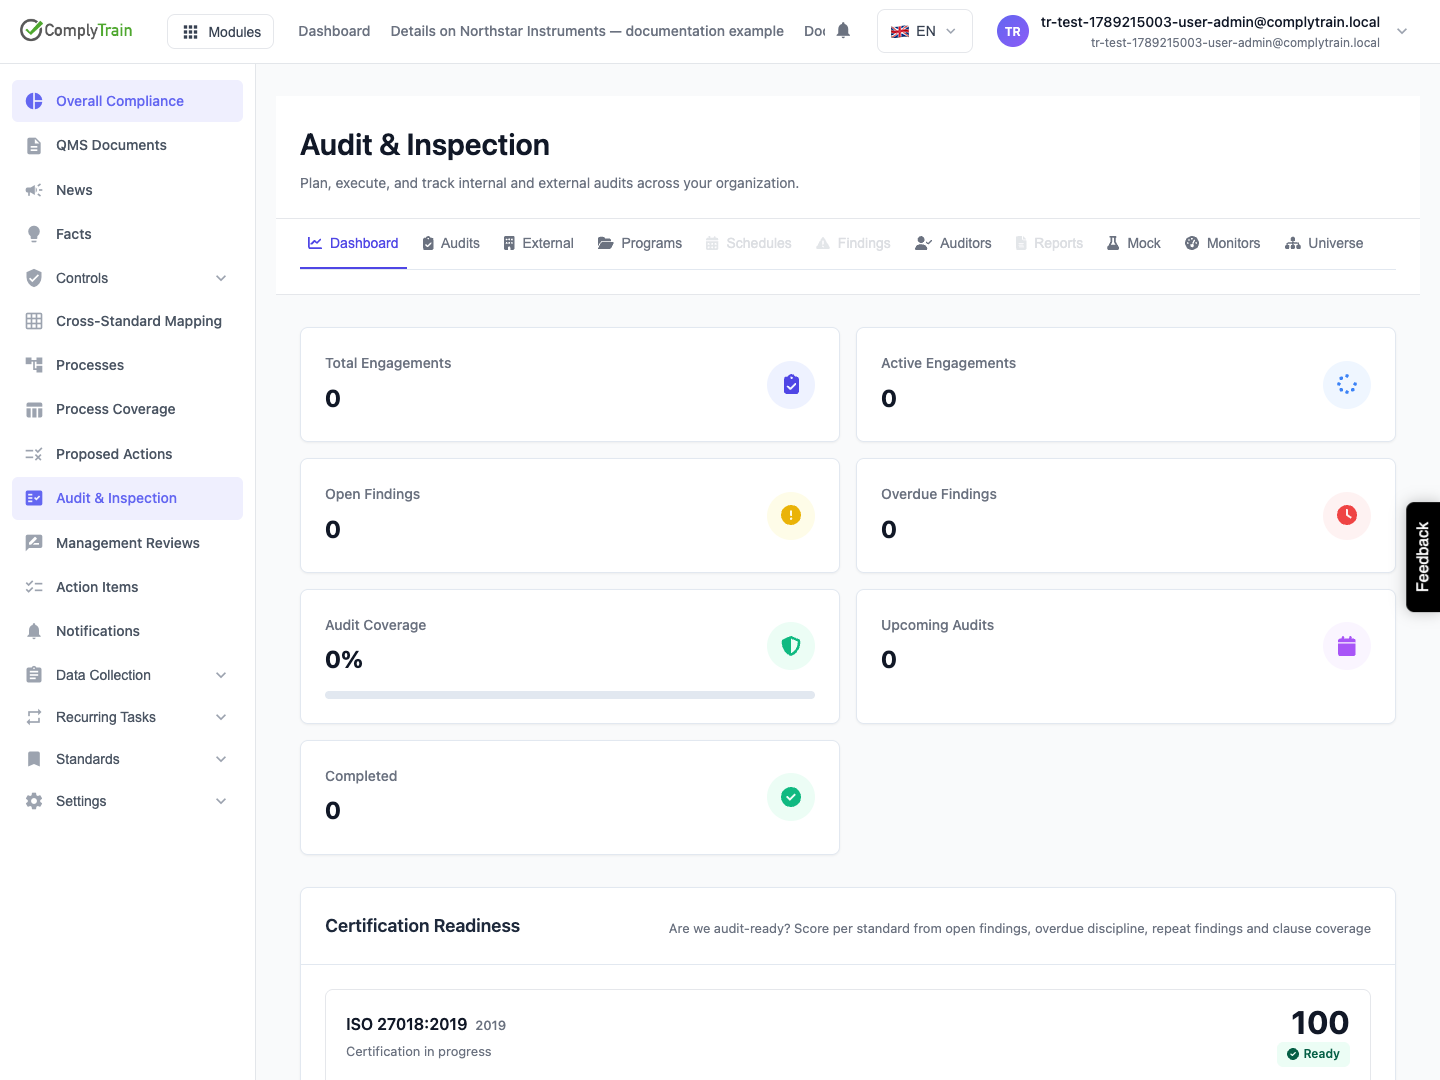
Read audit counts, compare standard scope, inspect monthly trends and follow up monitor and evidence signals.
Product location: /qms/audits. Select Dashboard.
Open Quality (QMS) → Audit & Inspection → Dashboard. The reporting requests require Manage audits permission. The page starts with tenant-wide audit counts, then readiness by standard, monitor health, stale evidence, insights, monthly trends, a clause heatmap and Findings Breakdown.
These panels use different populations and dates. There is no period selector on this screen, and the KPI cards do not open filtered records when clicked. Use the Audits, Findings, Schedules, Monitors or Universe tabs for follow-up. Changing tabs keeps the same browser URL; a product-location block therefore names the tab as a separate step.
Product location: /qms/audits. Select Dashboard.
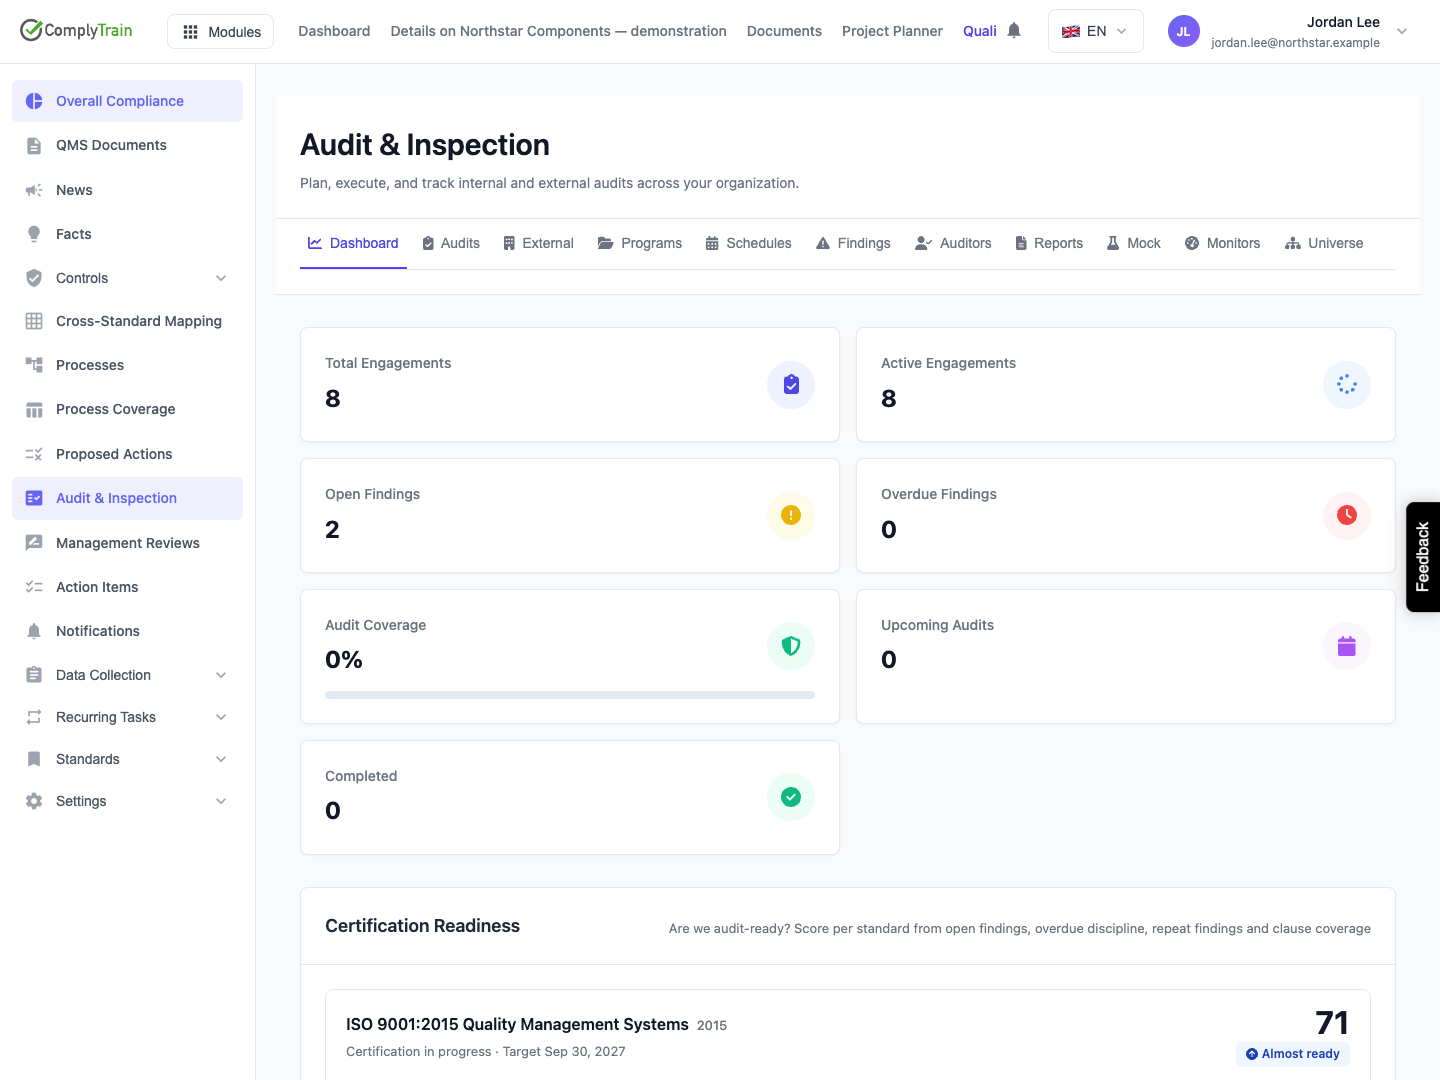
Card | What it counts |
|---|---|
Total Engagements | All tenant audit engagements, including cancelled records. |
Active Engagements | Engagements in Planning, Preparation, Fieldwork, Reporting or Follow-up, plus the older In Progress state. |
Completed | Engagements whose status is Closed. Completing one checklist or report does not by itself close the engagement. |
Open Findings | Findings whose status is neither Closed nor Accepted. This broad dashboard definition also includes drafts and other non-terminal states. |
Overdue Findings | Those open findings with a closure due date before today. A response deadline alone does not contribute to this headline card. |
Audit Coverage | Active audit-universe entities with a recorded last-audit date, divided by all active entities. There is no recency window. This is entity coverage, not clause coverage. |
Upcoming Audits | Active recurring schedules due by 30 days from today. Already overdue schedules also qualify; individual engagement dates do not drive this card. |
When there are no active audit-universe entities, coverage is not measurable, but this release displays 0%. Open Universe to distinguish an empty scope from an existing scope with no recorded audit dates.
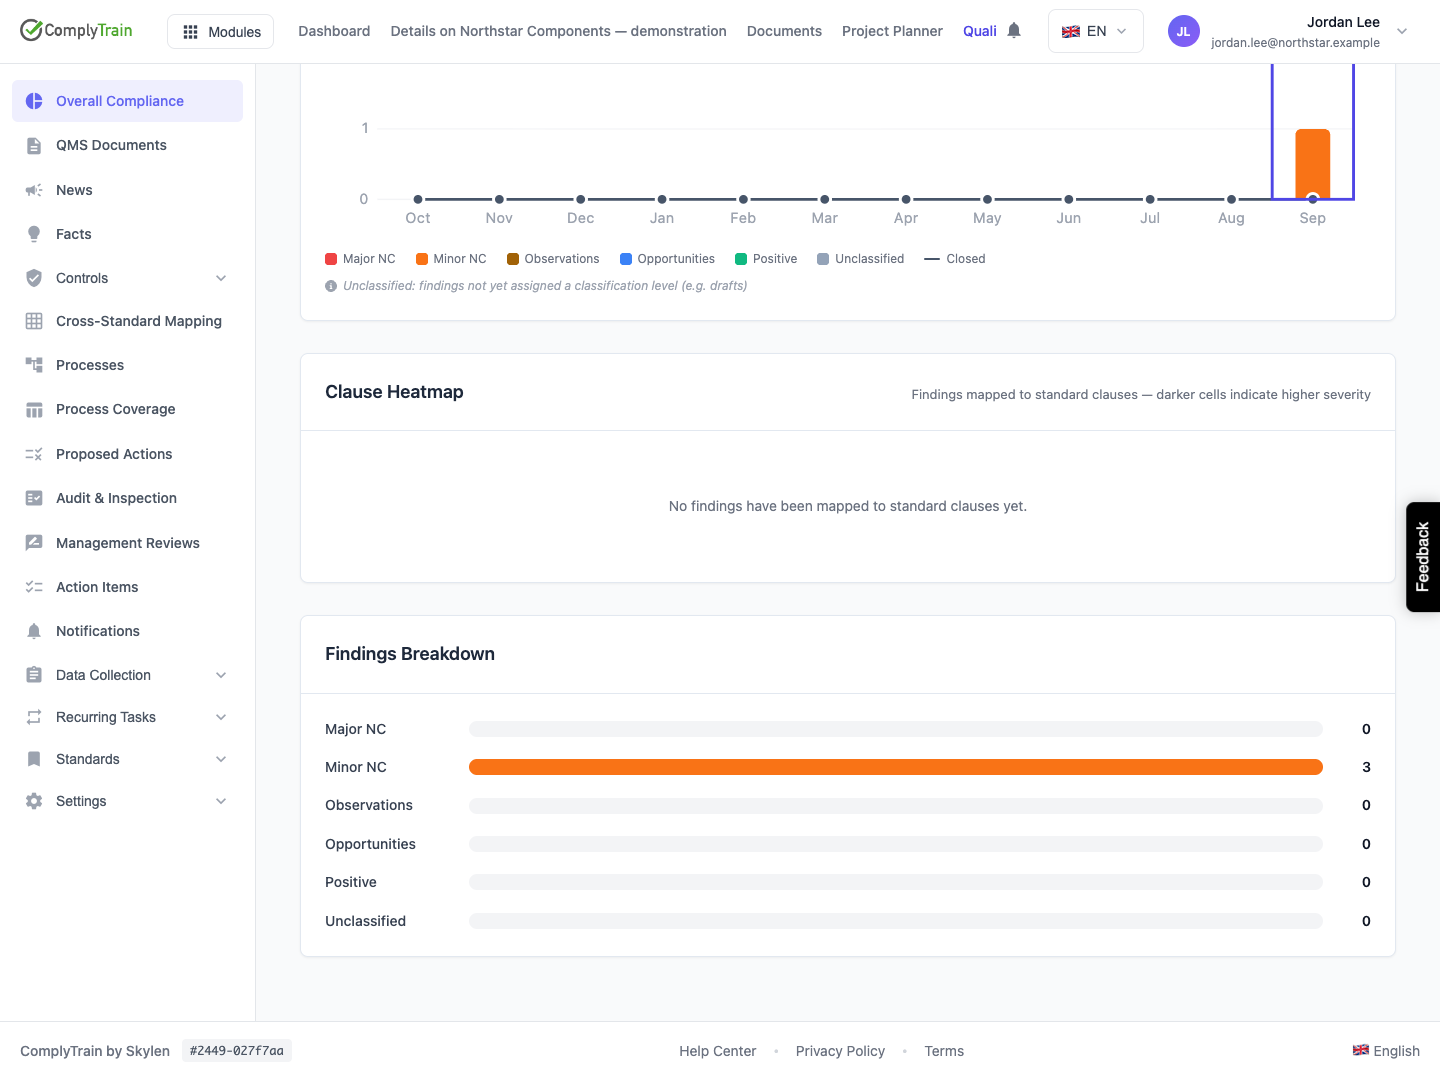
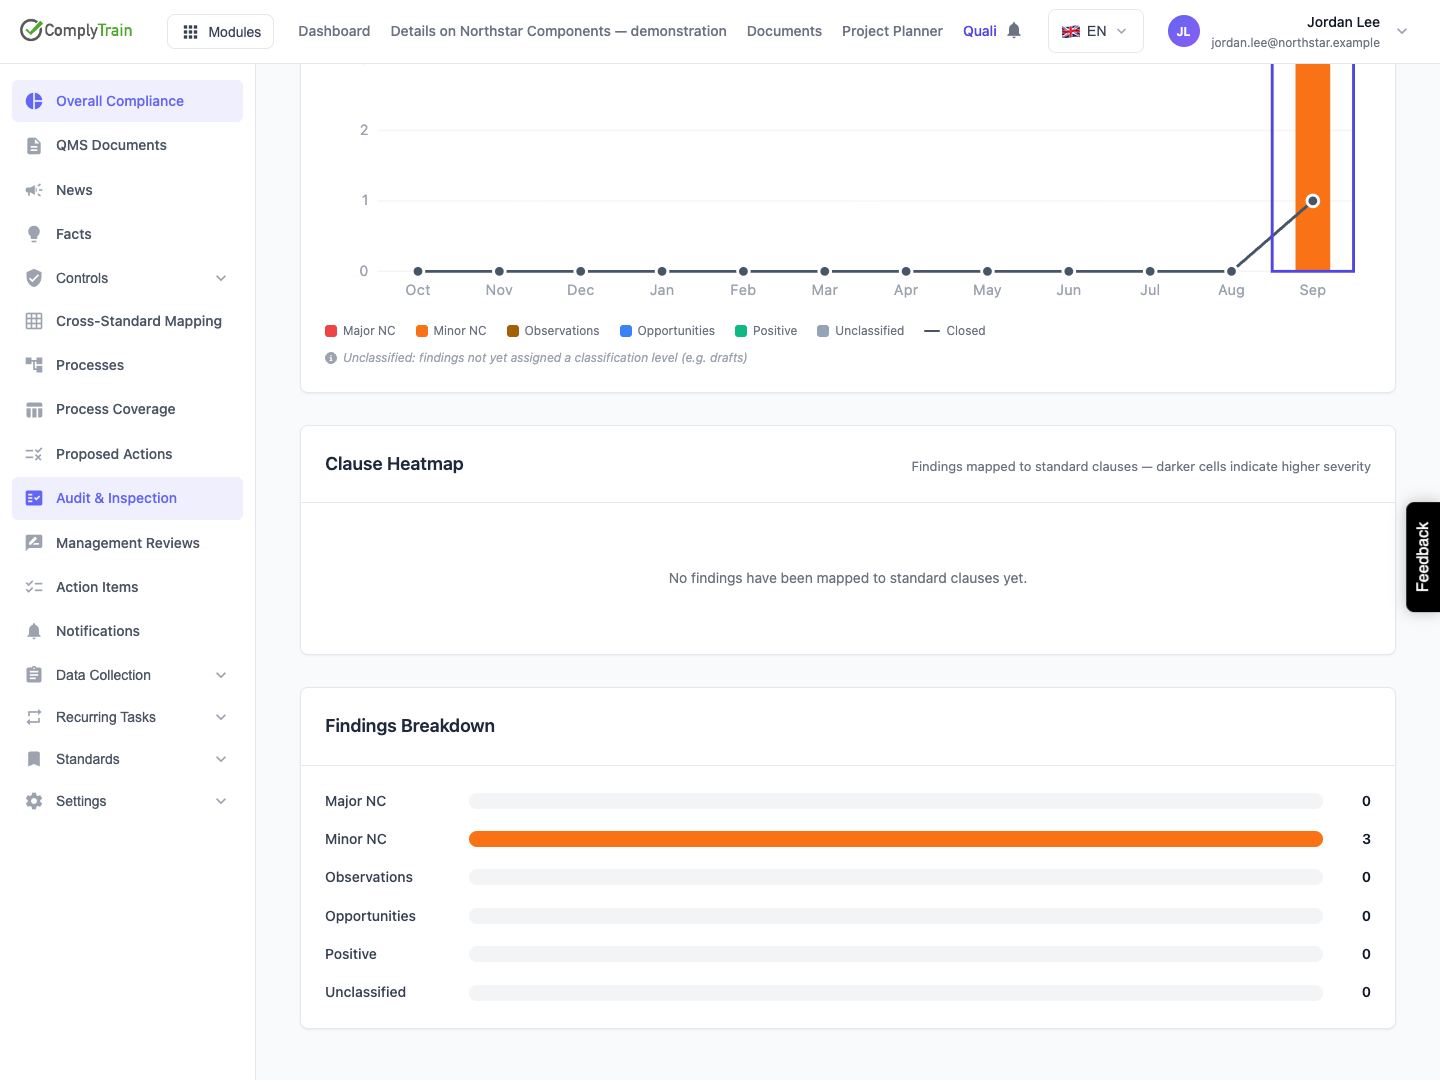
Findings Breakdown counts classifications across all finding states. For example, three minor nonconformities can coexist with two open findings when one of the three is closed. The breakdown is not an open-backlog chart.
Product location: /qms/audits. Select Dashboard. Scroll to Finding Trends.
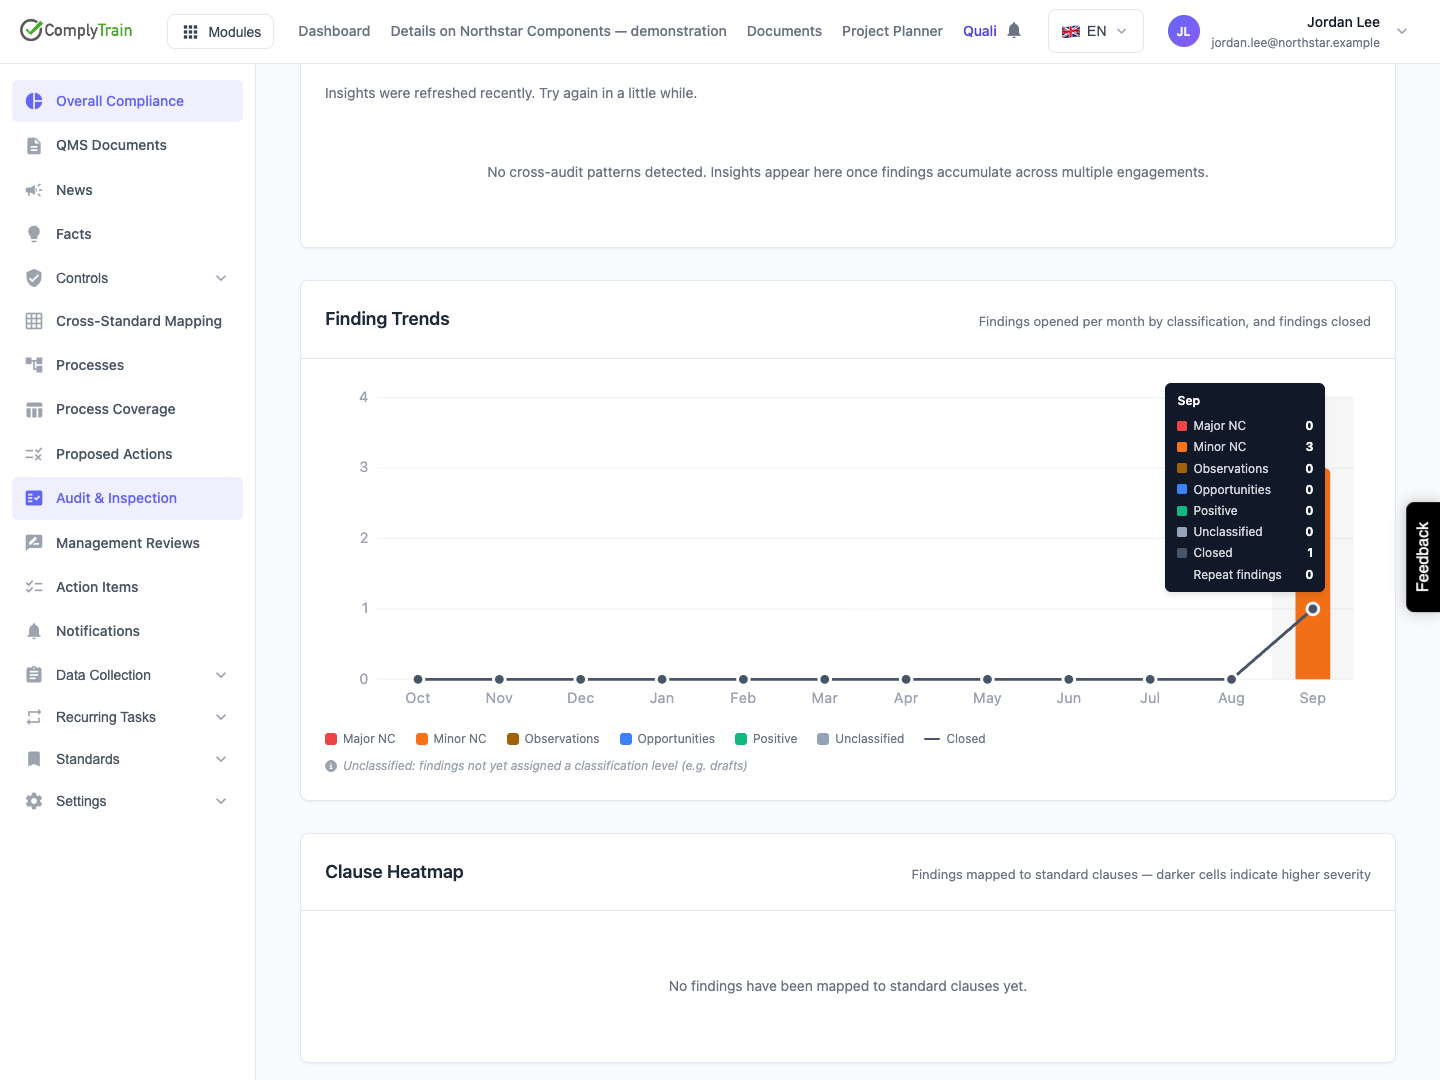
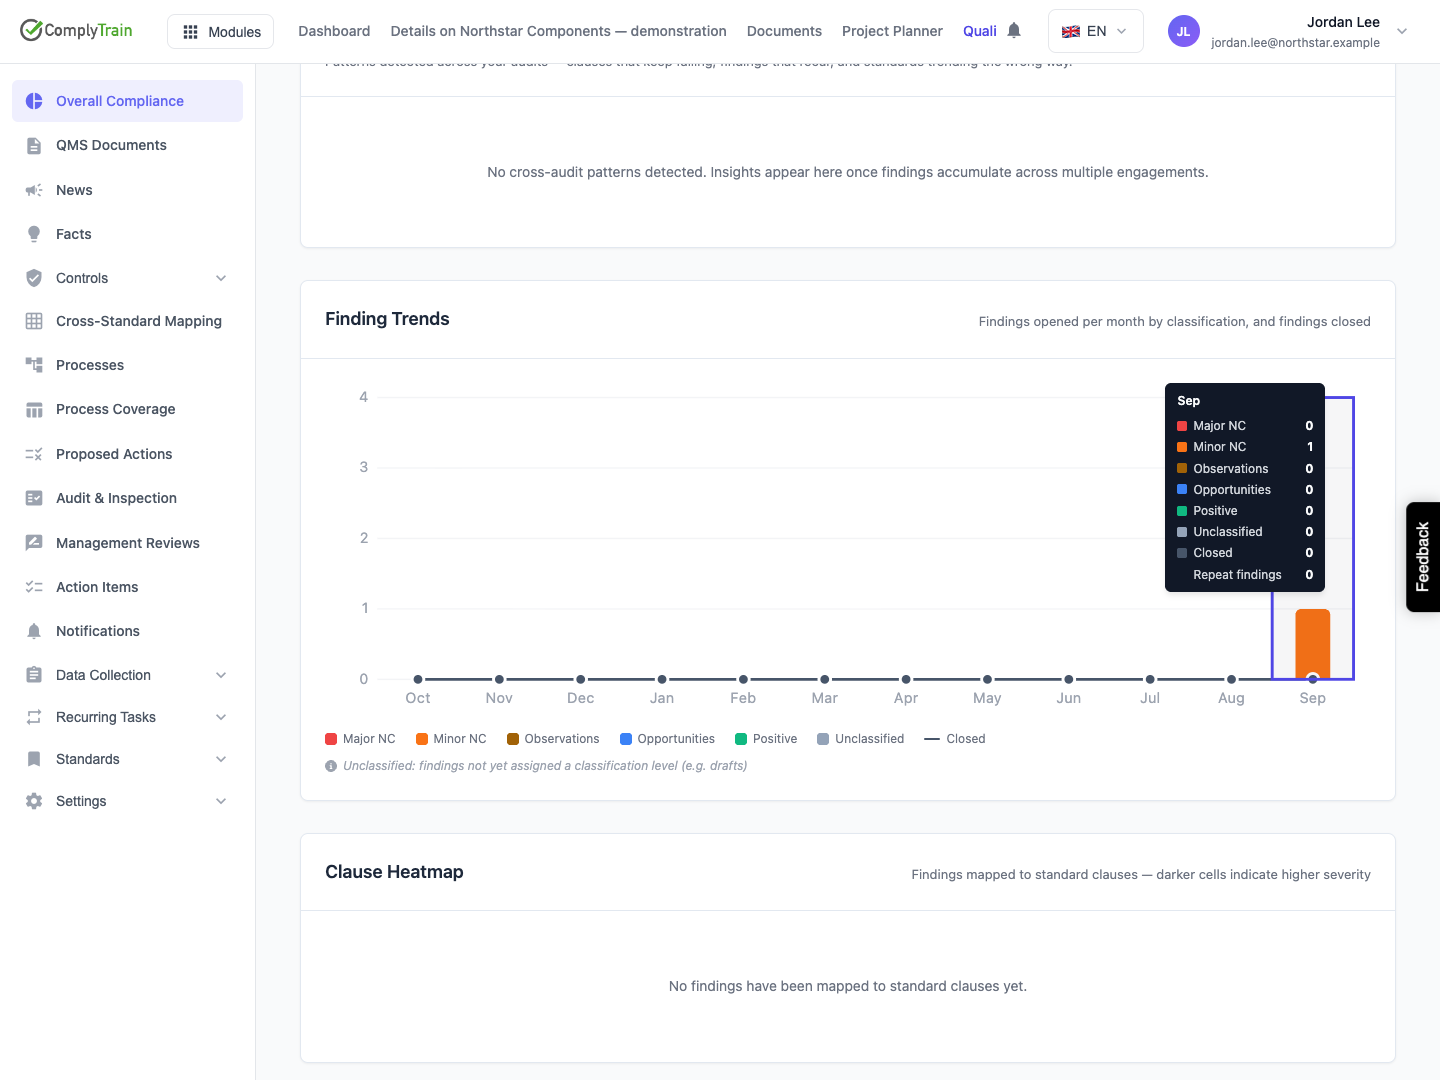
Finding Trends displays twelve calendar months ending in the current month, including months with zero activity. Columns group findings by their creation month and classification: Major NC, Minor NC, Observations, Opportunities, Positive and Unclassified. Classification and repeat flags are read from the current finding record, so later reclassification can change an earlier month's column.
The Closed line counts distinct findings whose status history records a transition to Closed or Accepted in that month. Closures predating the available status history are not represented. A finding reopened and closed again in a later month can contribute in both months; subtracting the line from the columns is not a complete backlog calculation.
Hover over or click a month, or use Tab to focus its chart column. The tooltip provides the class counts, closures and repeat count. Escape dismisses the tooltip. The chart also supplies a table for screen readers. The tooltip does not open the underlying findings; switch to Findings and inspect the relevant records.
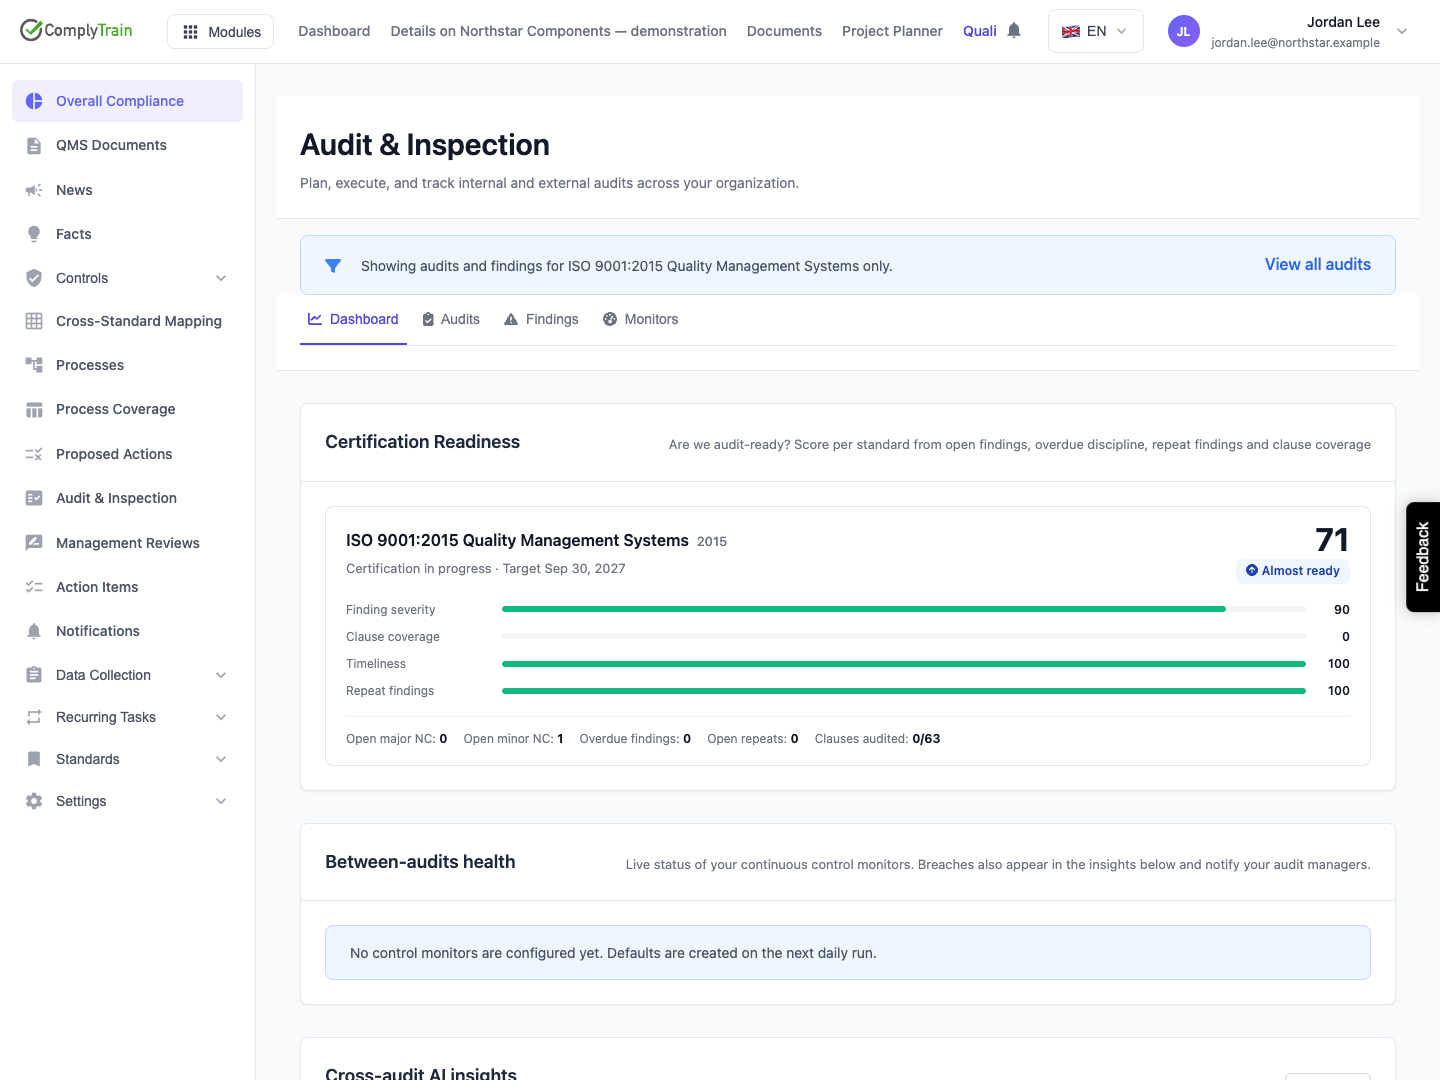
Product location: /qms/{standardCode}/audits (fallback: /qms/standards). Select Dashboard. Use View all audits to return to the tenant-wide audit workspace.
Open a standard's audit workspace from Standards, then choose Dashboard. The scope banner names the standard, and View all audits returns to the tenant-wide workspace. The standard workspace offers Dashboard, Audits, Findings and Monitors; use the tenant workspace for the other audit tabs.
Panel | Behaviour inside a standard workspace |
|---|---|
Headline KPI cards | Hidden because their source is tenant-wide. |
Readiness | Shows the selected standard. |
Finding Trends | Includes findings on engagements covering that standard. It does not use individual finding clause mappings for this filter. |
Clause Heatmap | Includes explicit mappings to that standard's clauses. |
Monitor health and insights | Includes records assigned to the standard. Tenant-wide monitors or insights with no standard are excluded. |
Stale evidence | This widget is absent from the standard audit dashboard; use the tenant-wide dashboard. |
Findings Breakdown | Remains tenant-wide in this release, despite the scope banner. Do not report it as a standard-specific total. |
The documentation example contains three minor findings tenant-wide, but only one on an ISO 9001 engagement. Its standard trend shows one; its bottom Findings Breakdown still shows three.
Product location: /qms/audits. Select Dashboard. Scroll to Clause Heatmap.
The heatmap contains only findings explicitly mapped to a standard clause. An empty heatmap can appear while the finding register and trend chart contain records. Creating an engagement for a standard does not automatically give each finding a clause coordinate.
A populated cell is designed to expose the clause name, total and open findings, classifications and repeats on hover or keyboard focus. Its colour uses 5 points per major NC, 3 per minor NC and 1 per observation across all states. Scores of 1–3 have the lowest nonzero shade, 4–9 the middle shade and 10 or more the darkest shade. Opportunities and positive findings contribute no severity points. Closing a finding reduces its open count but does not remove its historical severity contribution.
Cells provide information, not a drill-down link. Open Findings to investigate the mapped records. The illustrated walkthrough verifies the unmapped empty state; a populated-cell interaction remains to be exercised.
Product location: /qms/audits. Select Dashboard. Scroll to Between-audits health.
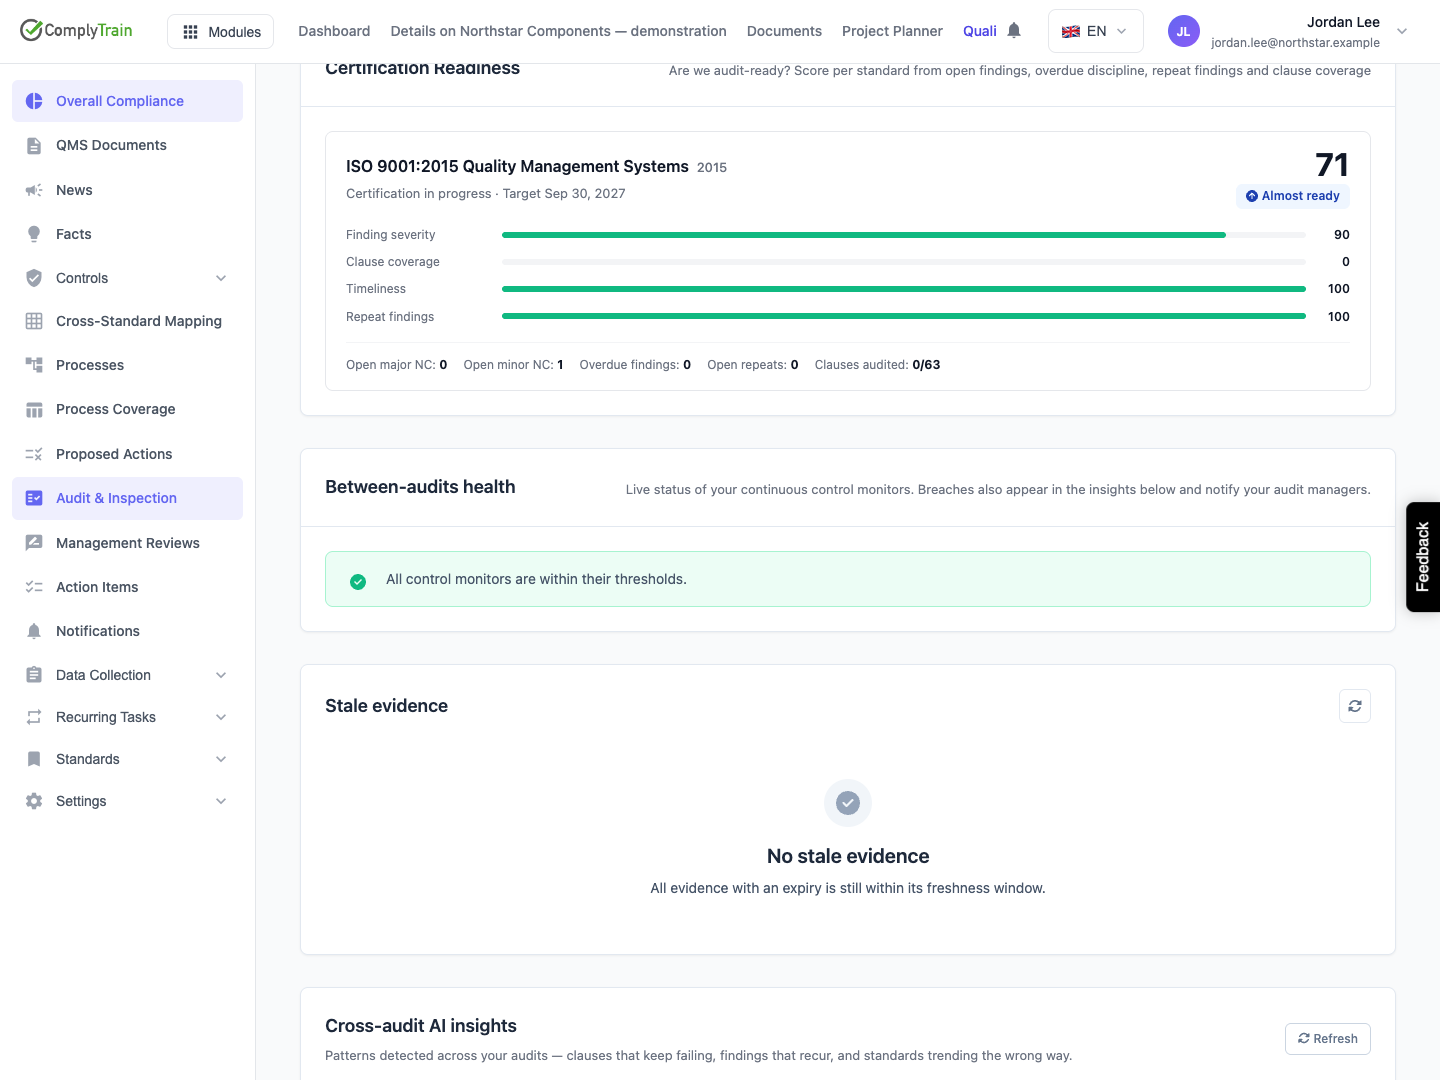
Between-audits health summarises the last recorded results of continuous monitors. A breach row shows its name, source, breach count and severity. No configured monitors produces a separate message. Loading failure produces an error, rather than a green result.
The green All control monitors are within their thresholds message means the returned list has no monitor marked as breaching. The list can include disabled monitors. Inspect Monitors for each monitor's enabled state, last evaluation and Not evaluated, OK or Breaching status before concluding that the intended controls are covered.
In a standard workspace, no monitors can mean none are specifically assigned to that standard, even when tenant-wide defaults exist. The empty message about defaults on a future daily run is not proof that the job ran or that standard-specific monitors will be created.
Product location: /qms/audits. Select Dashboard. Scroll to Stale evidence.
Stale evidence means an audit-evidence record has a Valid until timestamp in the past. It does not mean every old document or earlier version is automatically stale. Evidence without an expiry is excluded from this expiry check.
The widget displays at most five records, oldest expiry first. Its badge counts the displayed rows, not necessarily the tenant's full stale-evidence total. Rows show the evidence title, engagement, expiry date and days overdue. They are not clickable source links in this release.
Use the engagement name to find the audit under Audits, then inspect its evidence and the linked source document. Review the applicable freshness rule and collect or update evidence through the audit evidence workflow. Use the widget's refresh control to reload the list after saving. Do not change an expiry merely to clear an indicator.
Use cross-audit insights for recurring patterns and monitor drift. Review the actual findings before creating corrective action or changing audit scope.
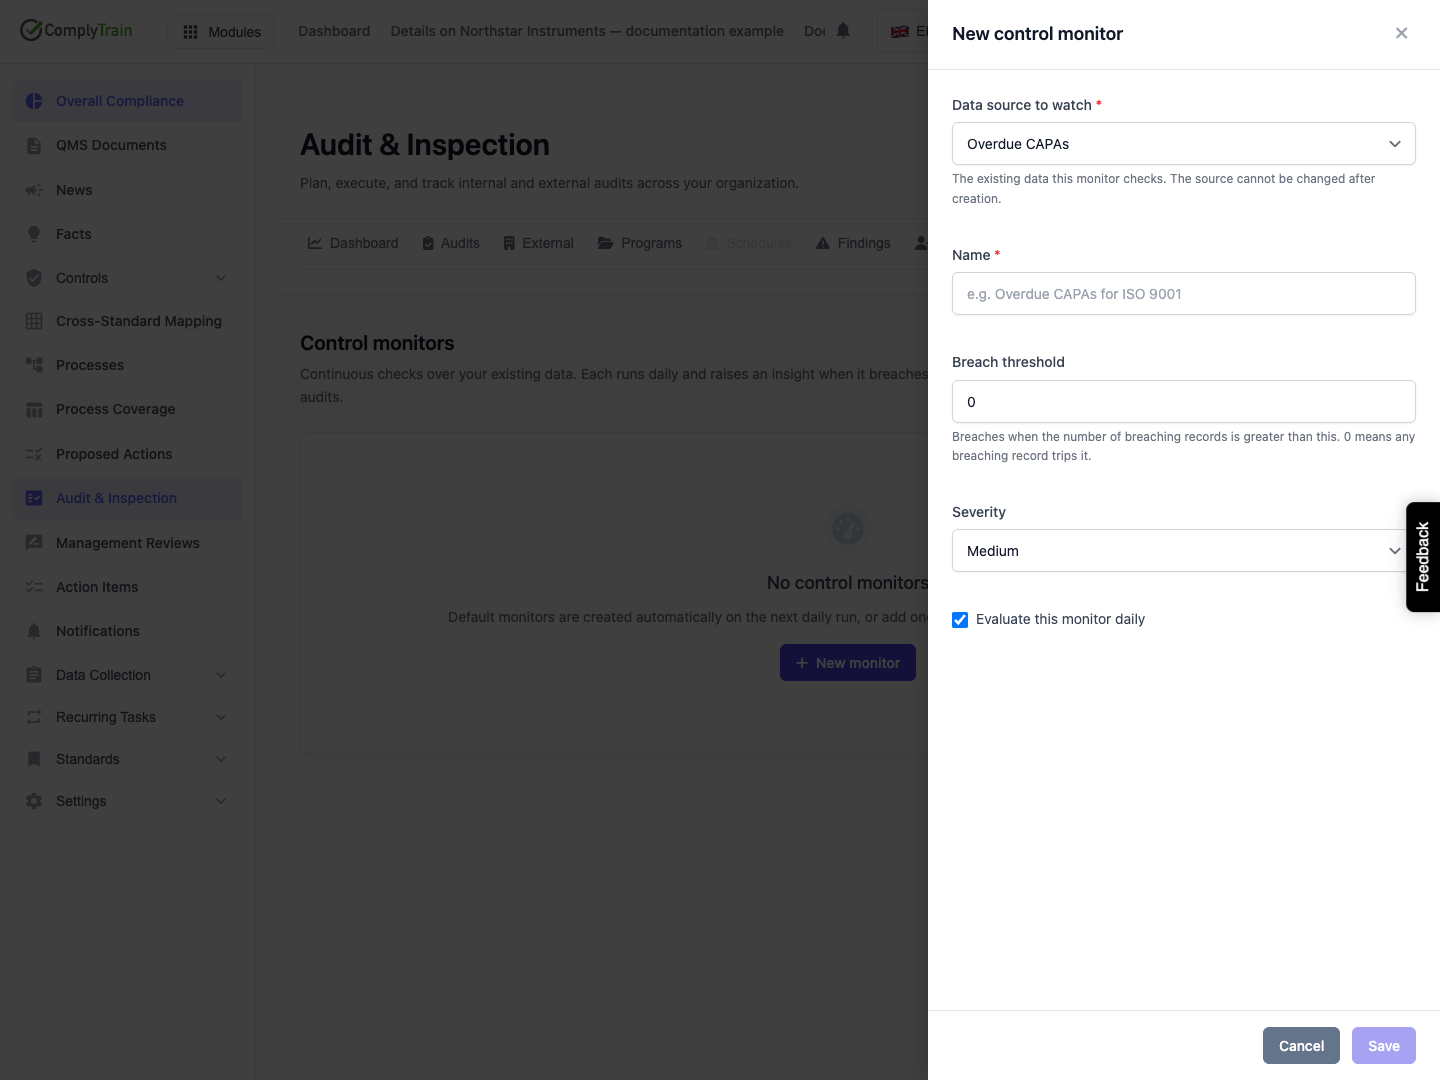
Product location: /qms/audits. Select Monitors. Open the intended monitor or create a new one.
Use the detailed monitor guide for source definitions, threshold rules, evaluation windows, severity, daily evaluation, disabled states and deletion. Open Monitors to create or edit a monitor; use Evaluate now there to request an evaluation.
A dashboard reload reads stored monitor results; it is not the same action as Evaluate now. Record follow-up work in the relevant task, finding or CAPA workflow, then verify the source change and the next evaluation.
Product location: /qms/audits. Select Dashboard.
No findings, no mapped clauses and no expired evidence are different statements. None establishes that an area has been audited. A readiness score can be high in an organisation with little or no recorded audit activity; use the readiness reference to interpret missing coverage.
Wait for panel loading to finish. If a panel displays a failure, use its Retry control; stale evidence has its own refresh/retry control. An error is not a zero result. If it persists, give the administrator the workspace URL, selected standard, panel name and time of the failure. Reopening the page reloads reporting data, but neither page loading nor an insight refresh proves that every background job has completed.